Sedona, AZ
August 2026
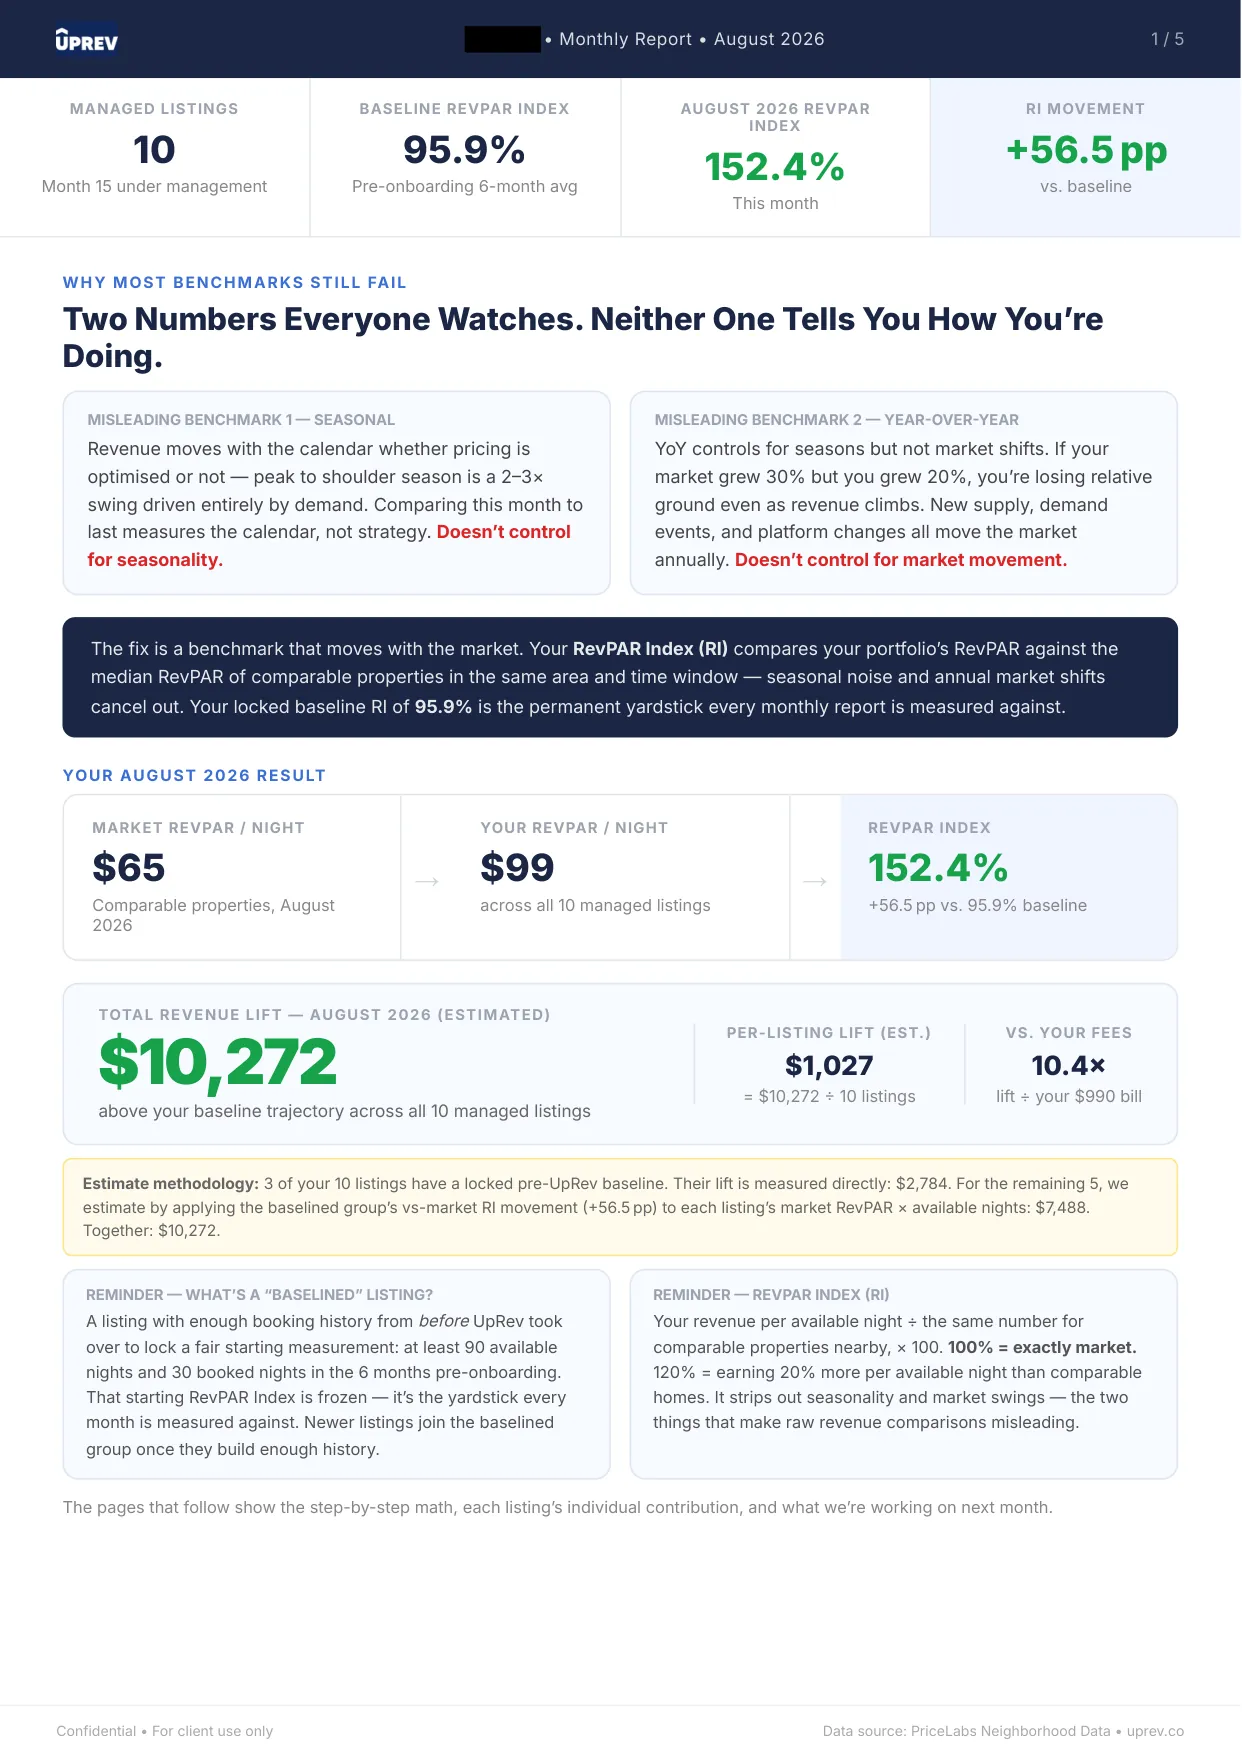
+56.5 pts
above baseline
3
baselined listings
10.4x
our fee, covered

Sedona is a drive-to leisure market built on red-rock scenery, and its guests book on weather windows and long weekends. Small portfolios dominate here, which cuts both ways: each listing’s pricing matters enormously, and each month’s numbers swing harder than they would on a big book.
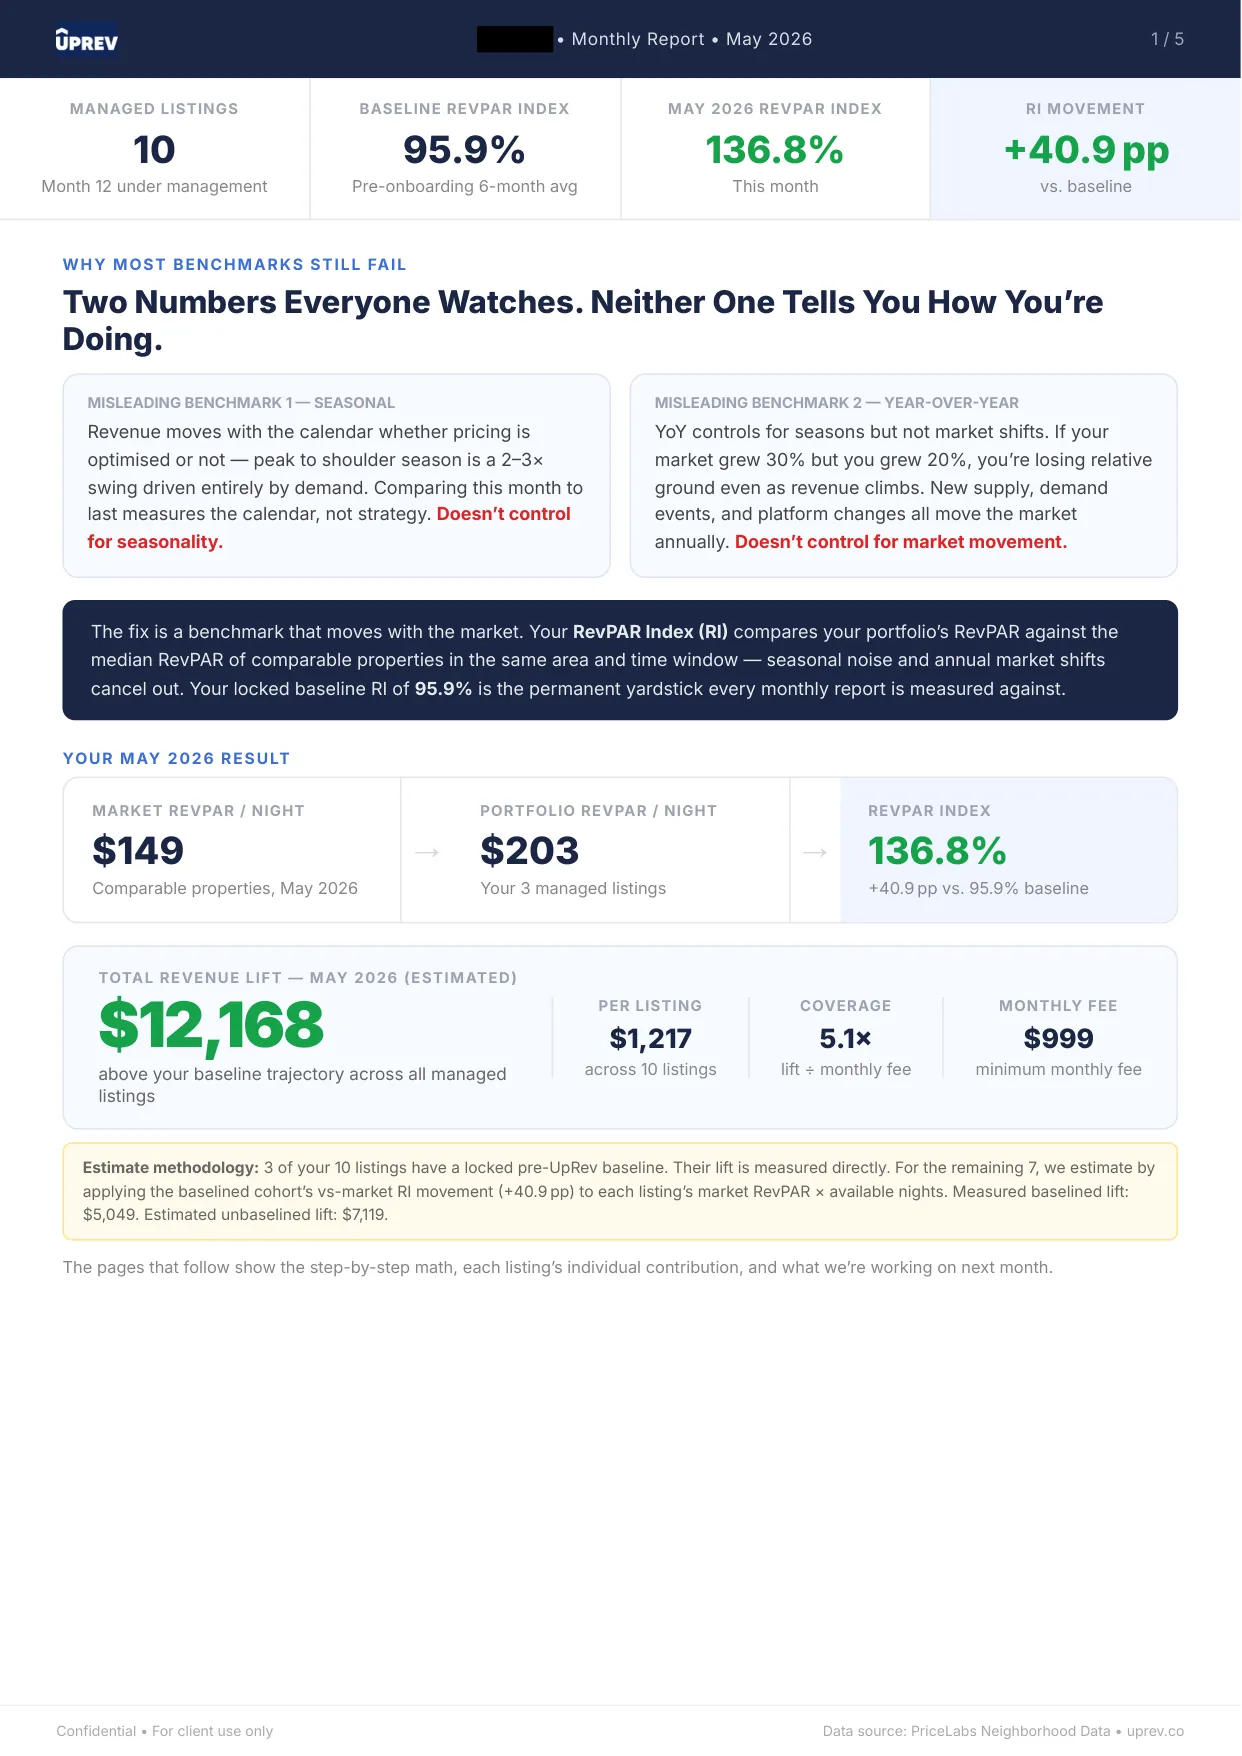
The Sedona reports below show the largest movement above a frozen baseline anywhere in our published set. We are direct about the context: this is also one of the smallest baselined listing groups we publish, and small groups swing. A three-listing portfolio can post a spectacular month in a way a twenty-listing portfolio mathematically cannot.
That is exactly why the frozen baseline matters. However hard the small-sample numbers move, they are measured against the same fixed day-one score every month, so the trend across months, not any single month, is the story a Sedona owner should read.
Company names, owner names and addresses are redacted; every figure is untouched. Full-size viewer on the proof page. How the baseline works: the frozen baseline method.
The first step is a free revenue map built from your own numbers: where each listing sits against the homes it actually competes with, and what that gap is worth. No commitment, and the map is yours to keep either way.