San Diego, CA
July 2026
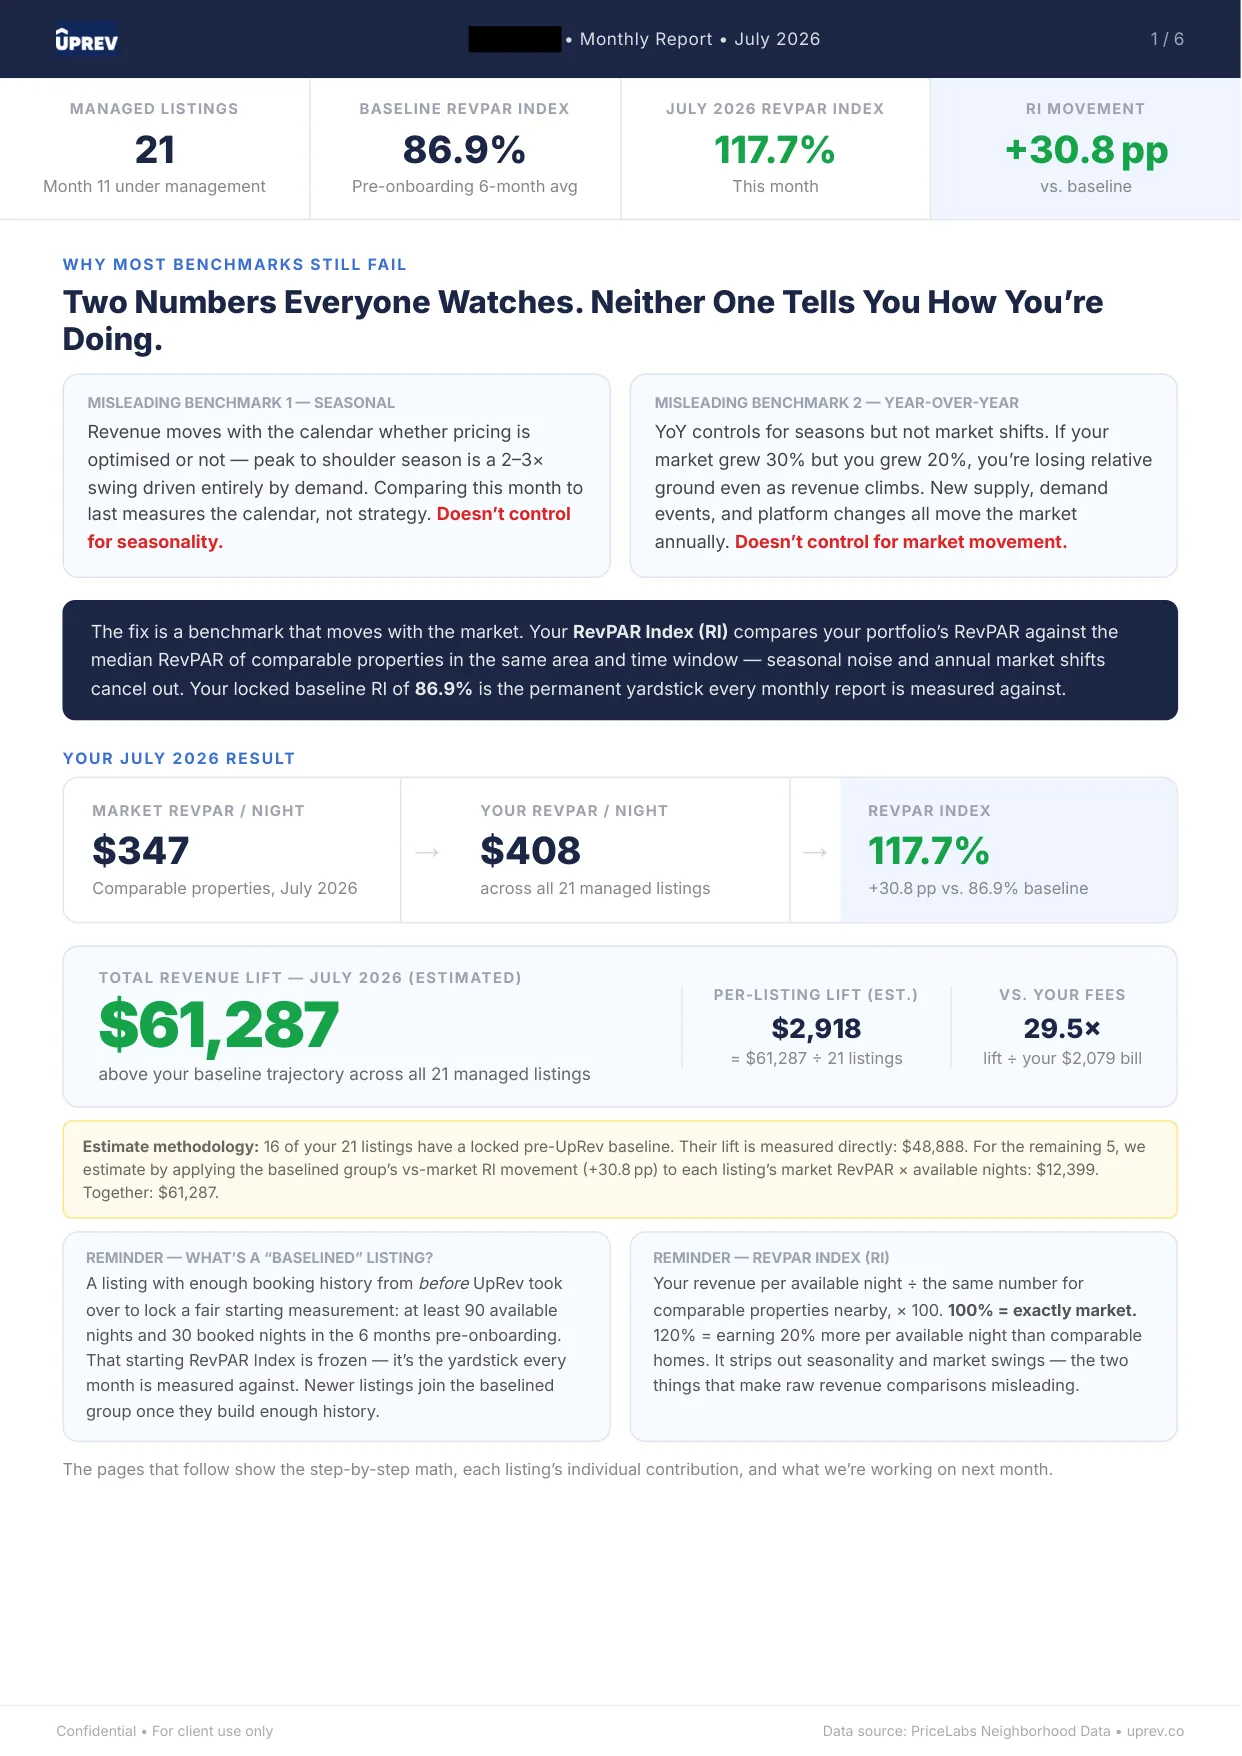
+30.8 pts
above baseline
16
baselined listings
29.5x
our fee, covered

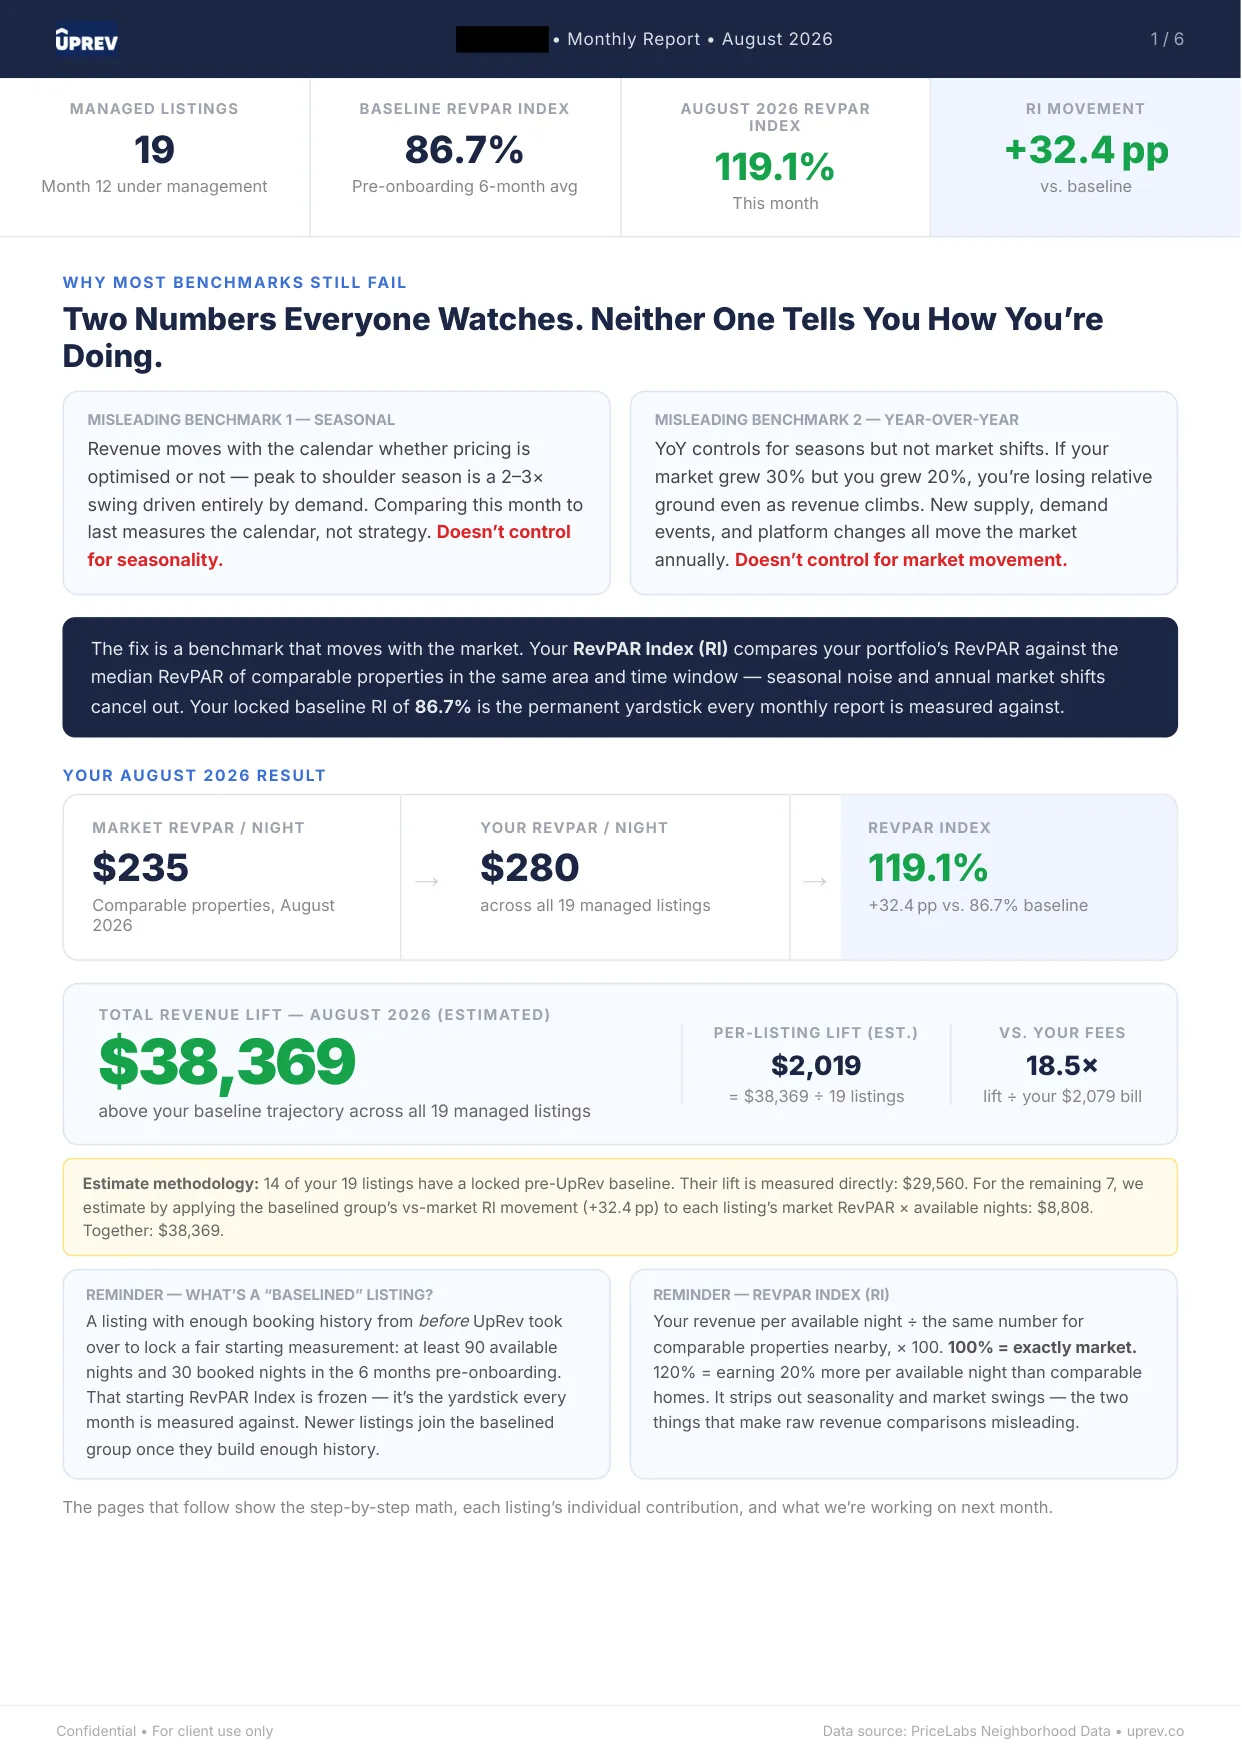
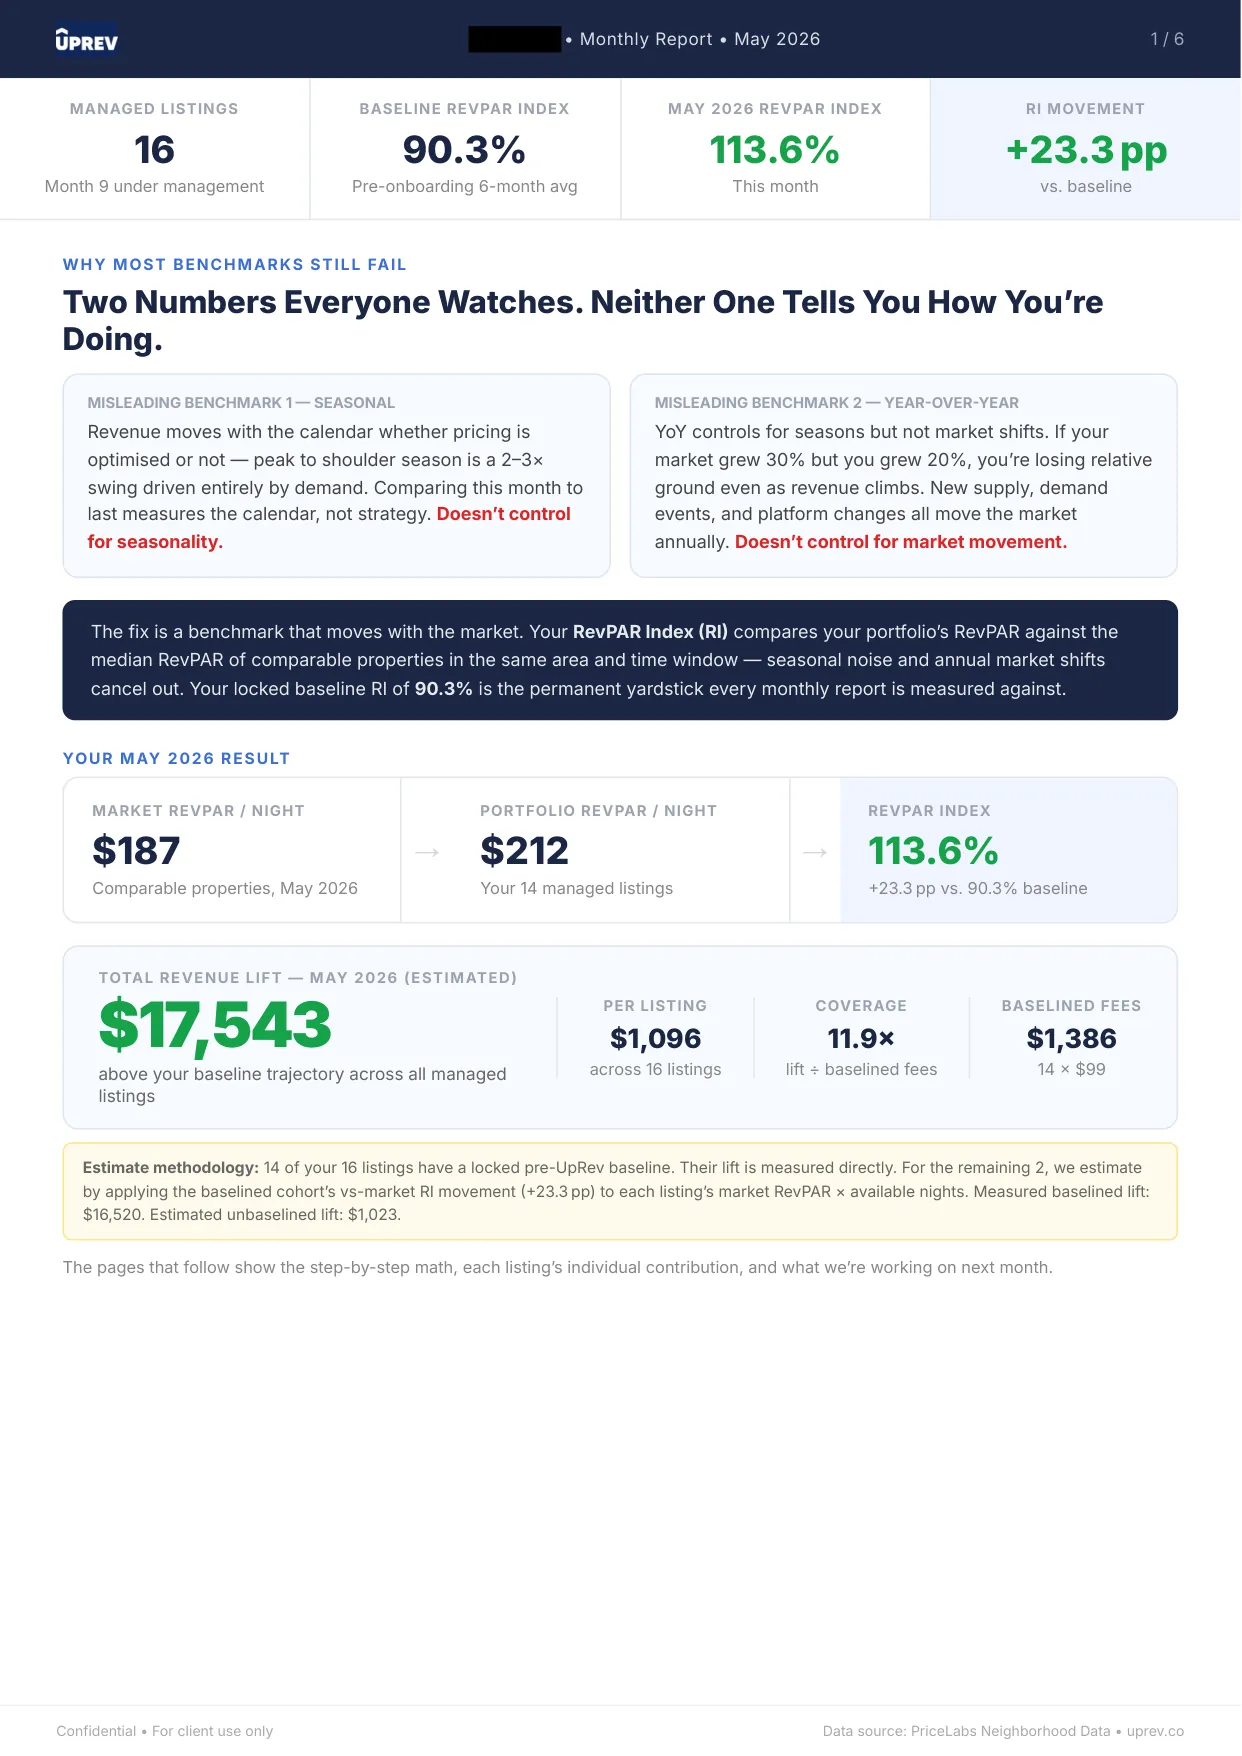
San Diego rewards precision more than almost any coastal California market: the gap between a well-priced summer week and a lazily priced one is enormous, and the shoulder seasons separate managed portfolios from neglected ones. Three San Diego report months are published below, running from spring into late summer, so you can see the same market handled at three different points in its demand curve.
The May report shows a portfolio being positioned while demand was still building: rates walked up deliberately as the booking window compressed, minimum stays tightened around the weeks that would fill regardless. The July report lands in peak season, where the earlier positioning pays and the portfolio climbs well clear of its frozen starting score.
Beach markets punish two opposite mistakes: pricing summer like it needs discounting, and pricing winter like it is still summer. The reports below are what avoiding both looks like in practice, written up in the same document the client received.
Company names, owner names and addresses are redacted; every figure is untouched. Full-size viewer on the proof page. How the baseline works: the frozen baseline method.
The first step is a free revenue map built from your own numbers: where each listing sits against the homes it actually competes with, and what that gap is worth. No commitment, and the map is yours to keep either way.