Los Angeles, CA
August 2026
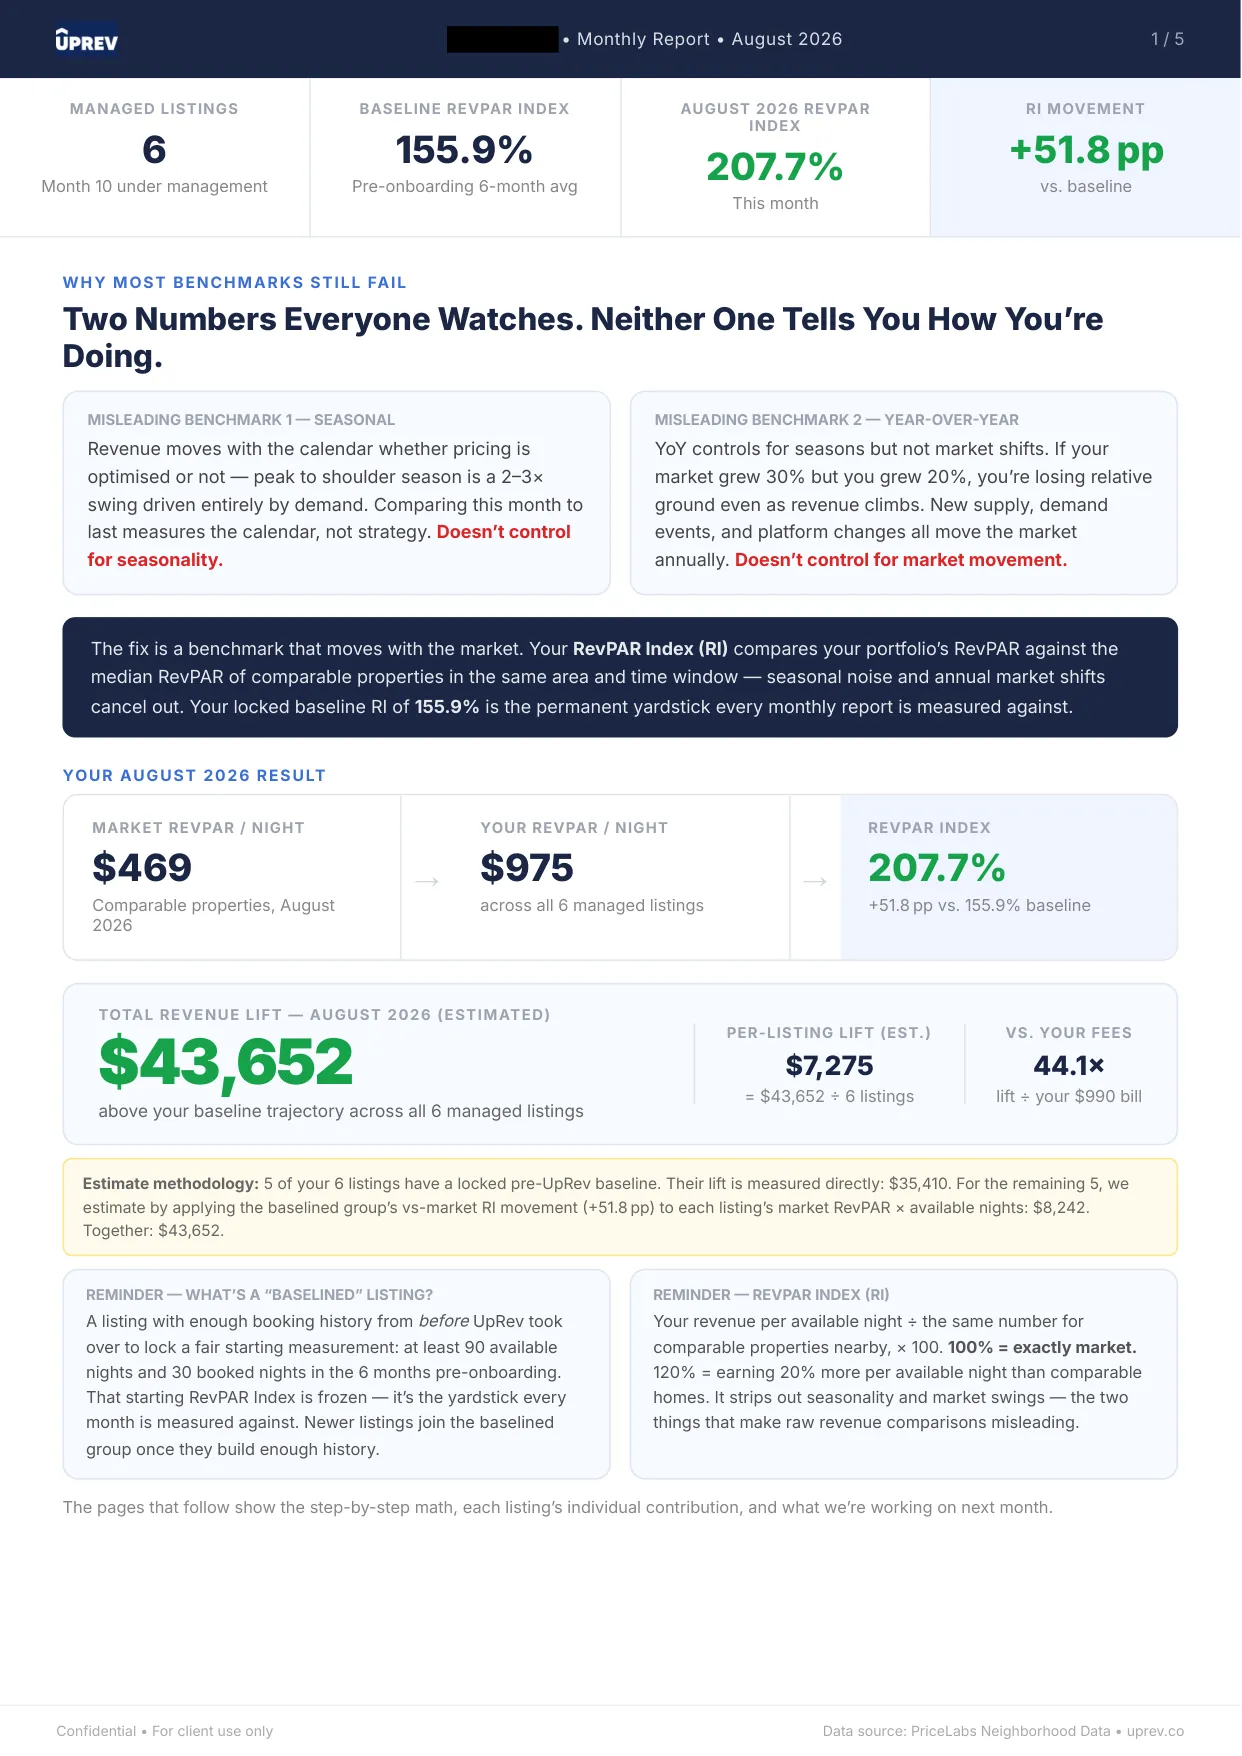
+51.8 pts
above baseline
5
baselined listings
44.1x
our fee, covered

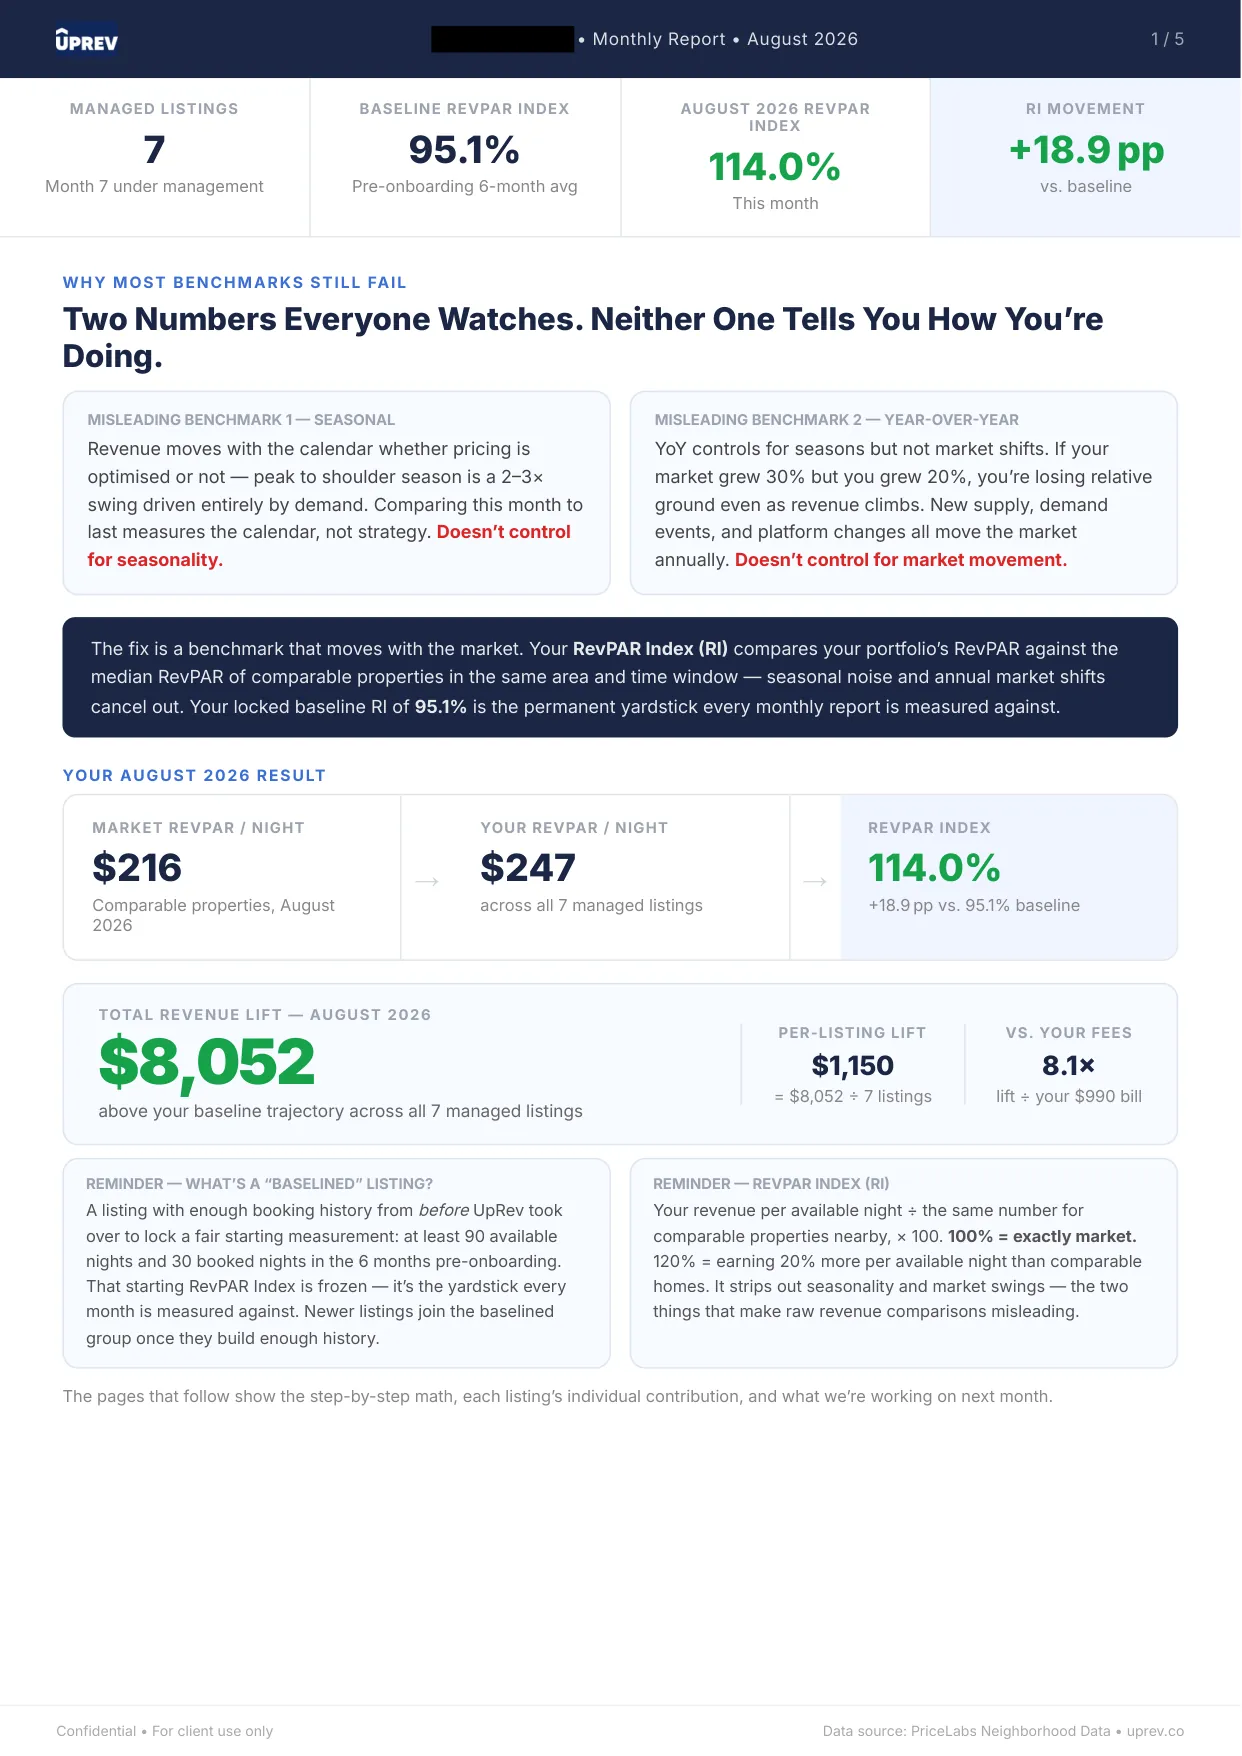
Los Angeles is the largest and most fragmented short-term rental market UpRev manages in: thousands of competing listings, every property type, and demand that shifts block by block. Five LA reports are published on our proof page, and together they show what daily pricing does here over time rather than in one flattering snapshot.
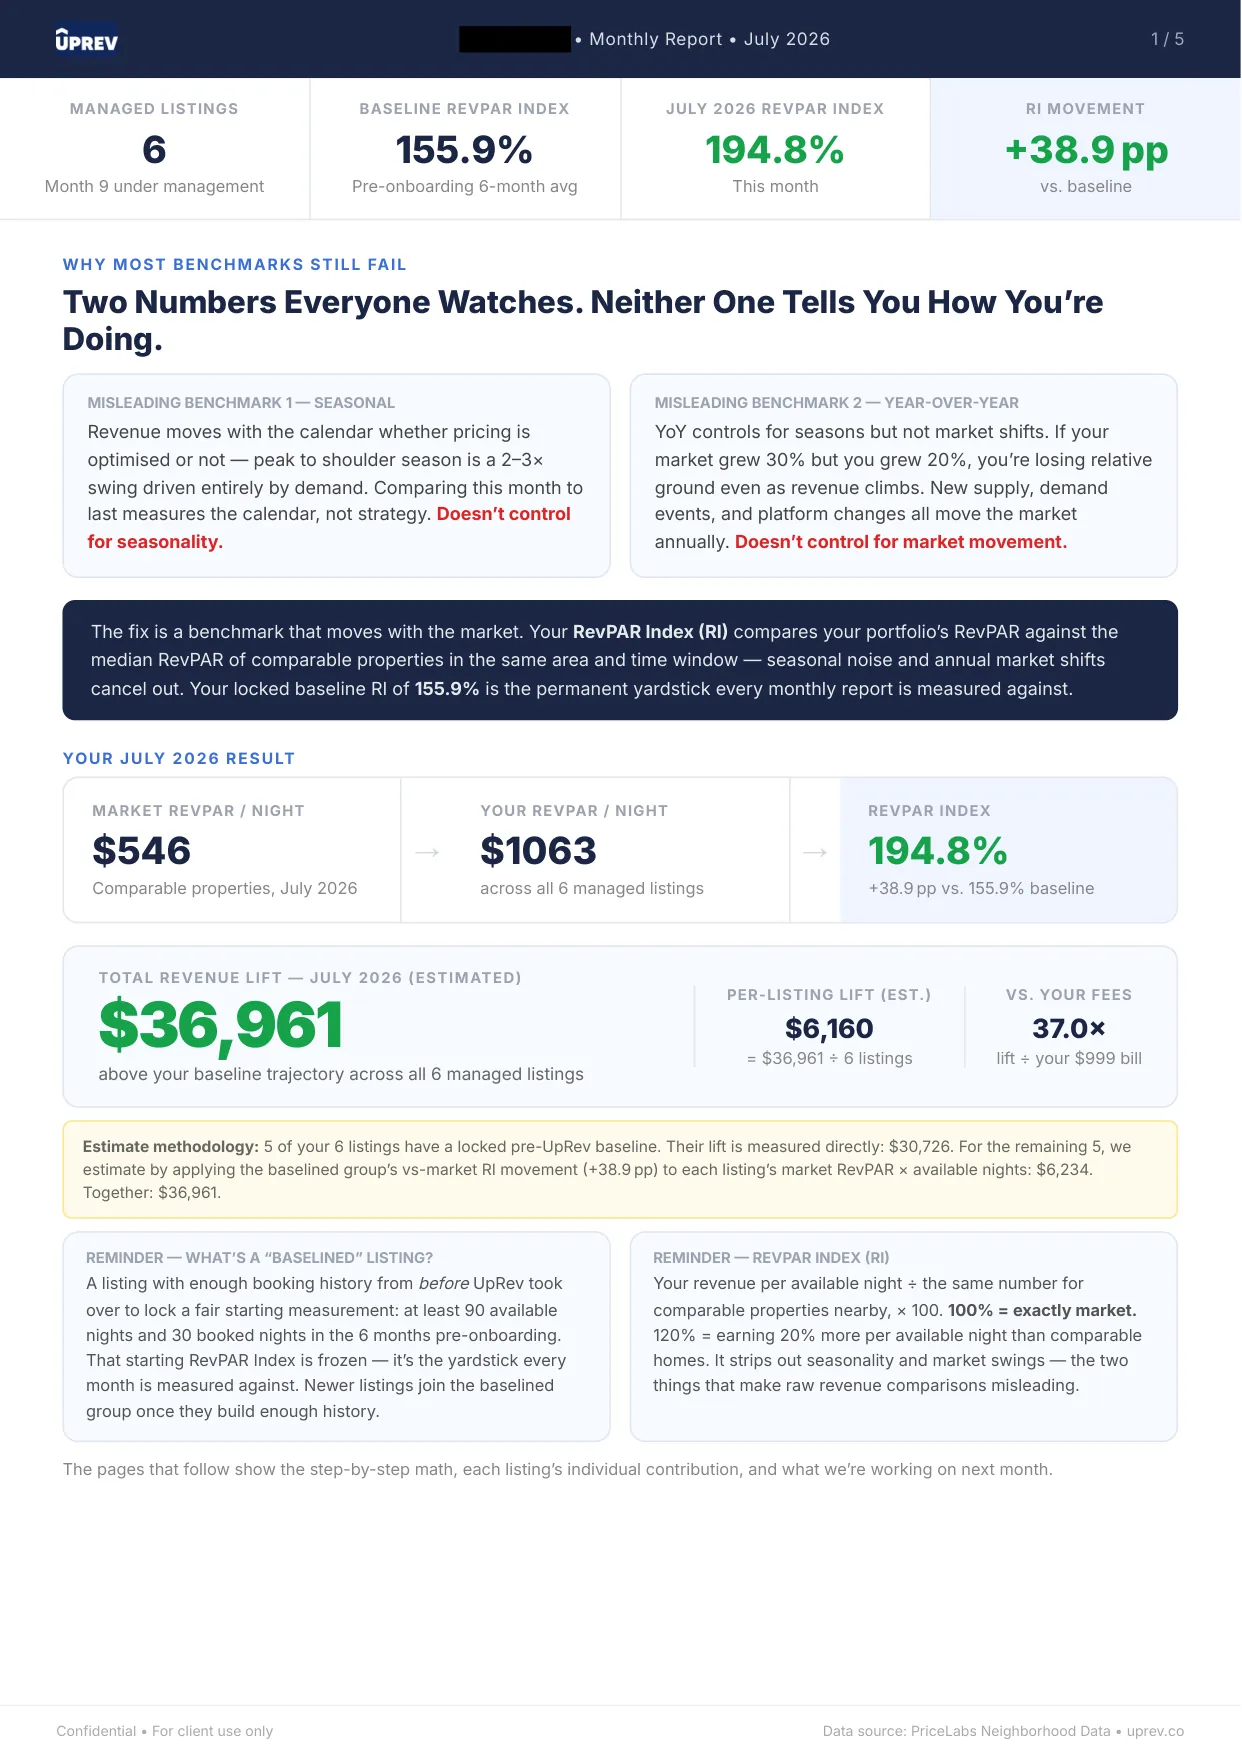
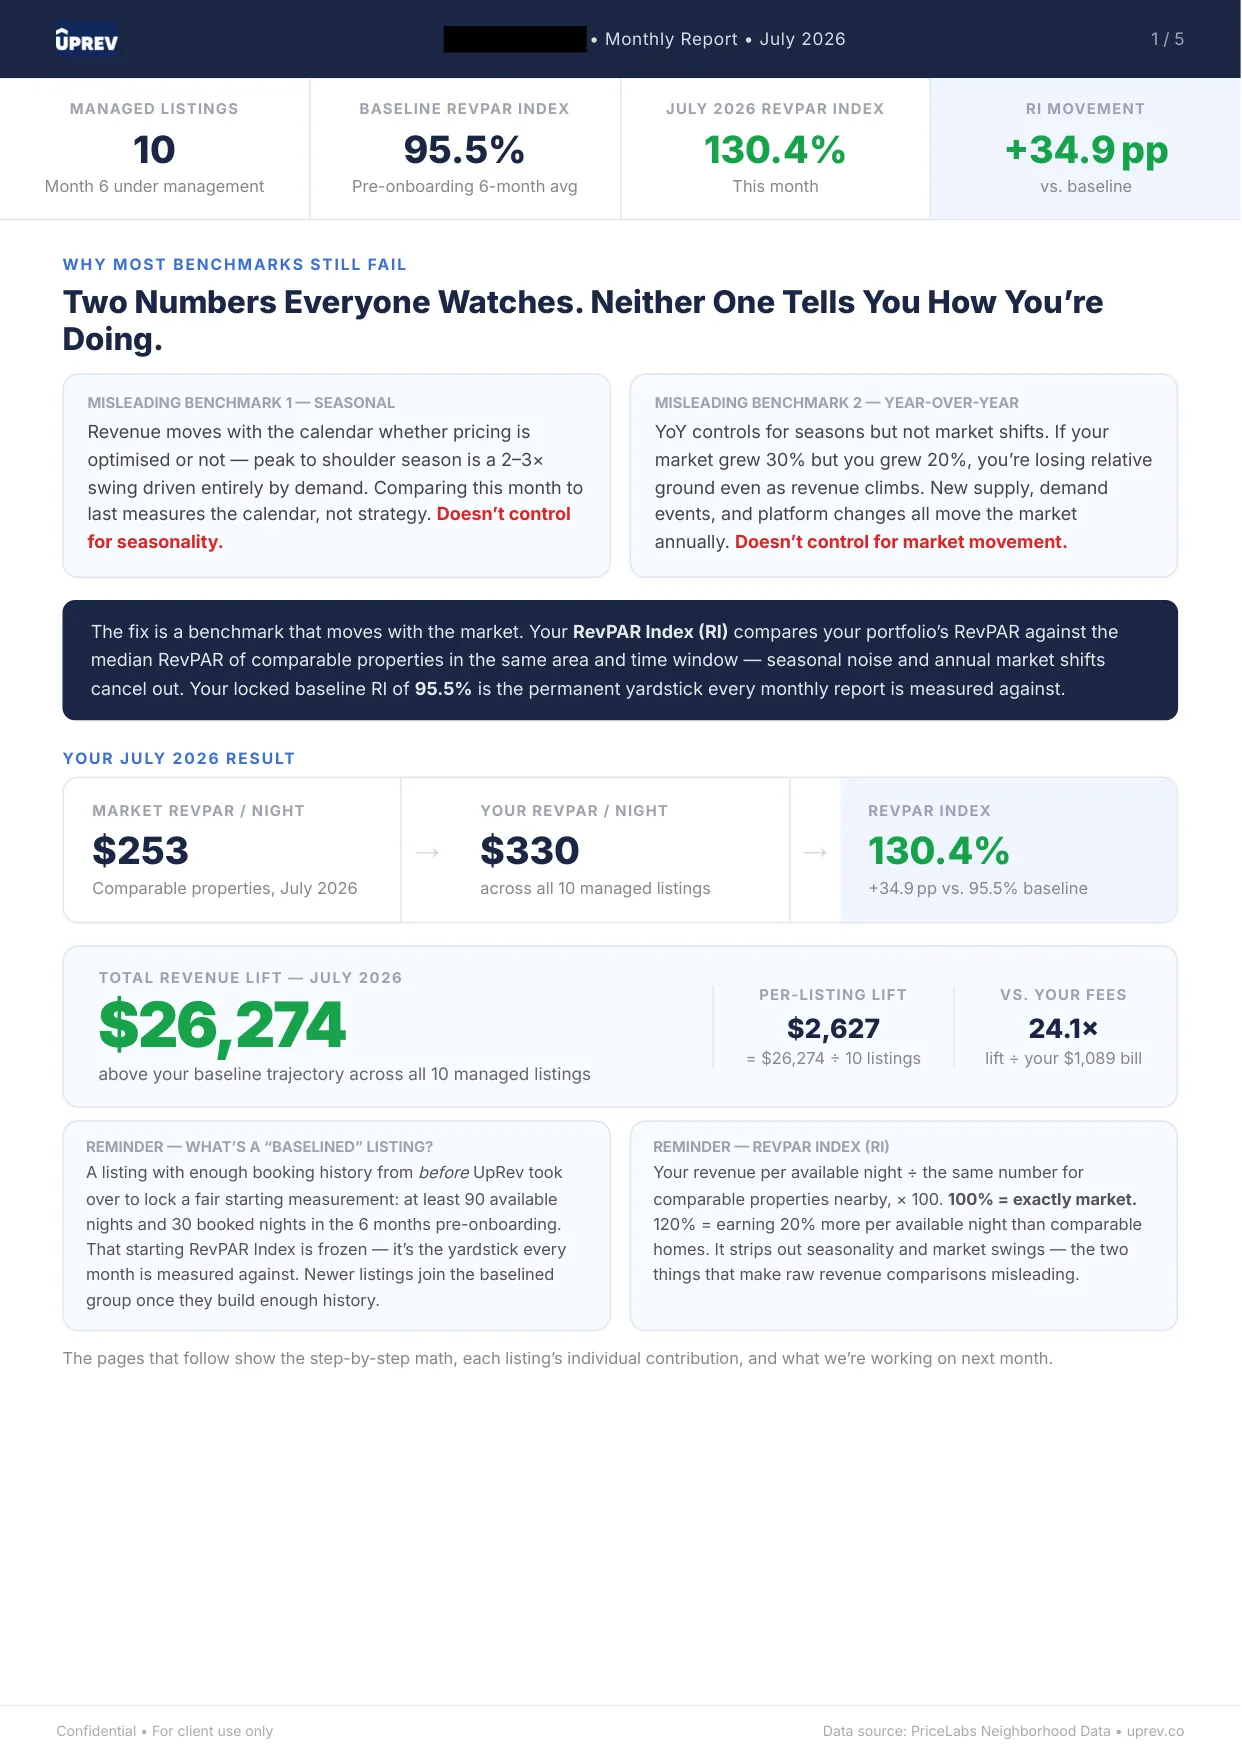
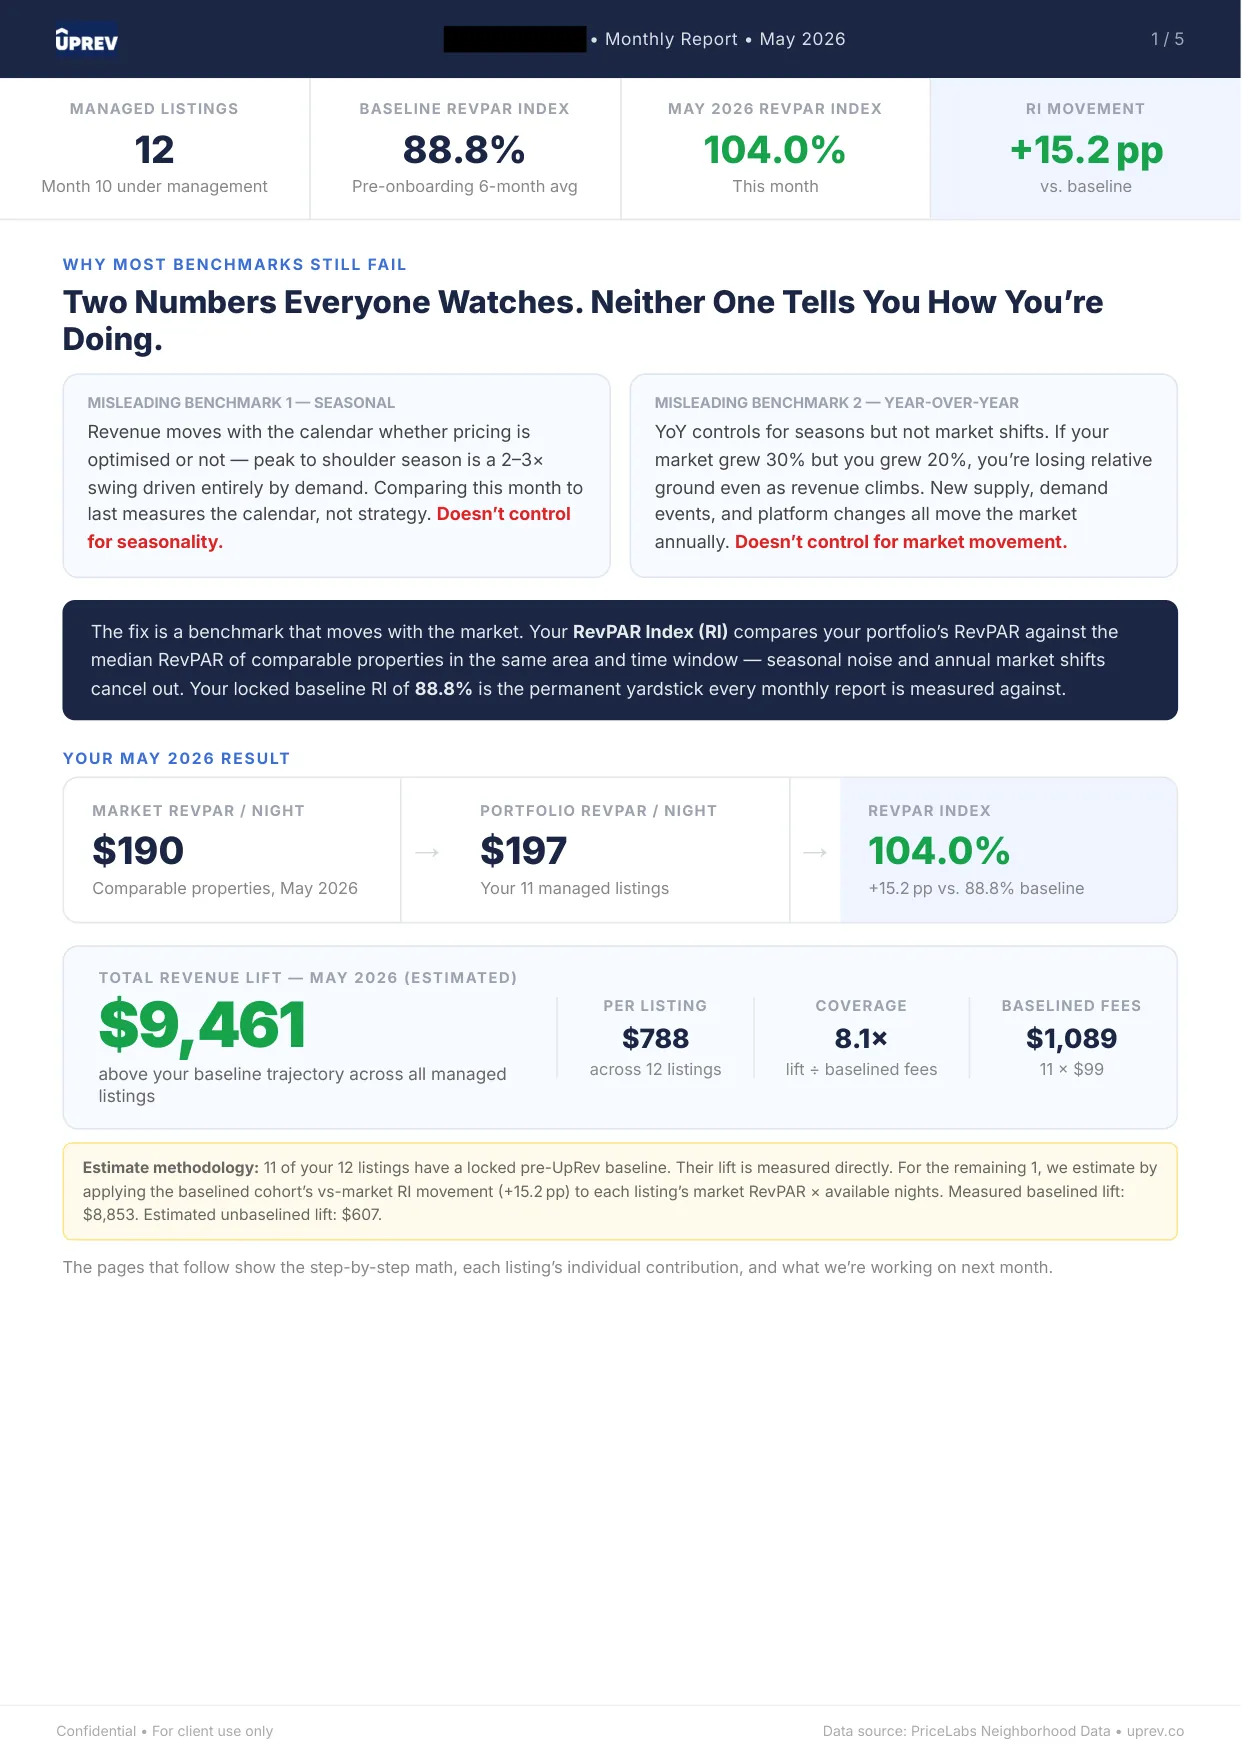
A single cherry-picked month tells a manager nothing. These five documents cover managed LA books at different starting points, several of them the same book measured again in a later month, and their results range from dramatic climbs above the frozen baseline to modest, steady gains. Repetition is the point: same method, same measurement, with the arithmetic left on the page.
What every one of the five has in common is direction. Each report sits above the market score we froze on day one, which is the only comparison that cannot be gamed by a rising market or a lucky season.
In a market with this much supply, the cost of leaving pricing on autopilot compounds fast: a listing priced against the wrong competitive set bleeds occupancy to the block next door. The portfolios below are priced daily against the specific homes they actually compete with, and the reports show the arithmetic from market score to dollars.
Company names, owner names and addresses are redacted; every figure is untouched. Full-size viewer on the proof page. How the baseline works: the frozen baseline method.
The first step is a free revenue map built from your own numbers: where each listing sits against the homes it actually competes with, and what that gap is worth. No commitment, and the map is yours to keep either way.