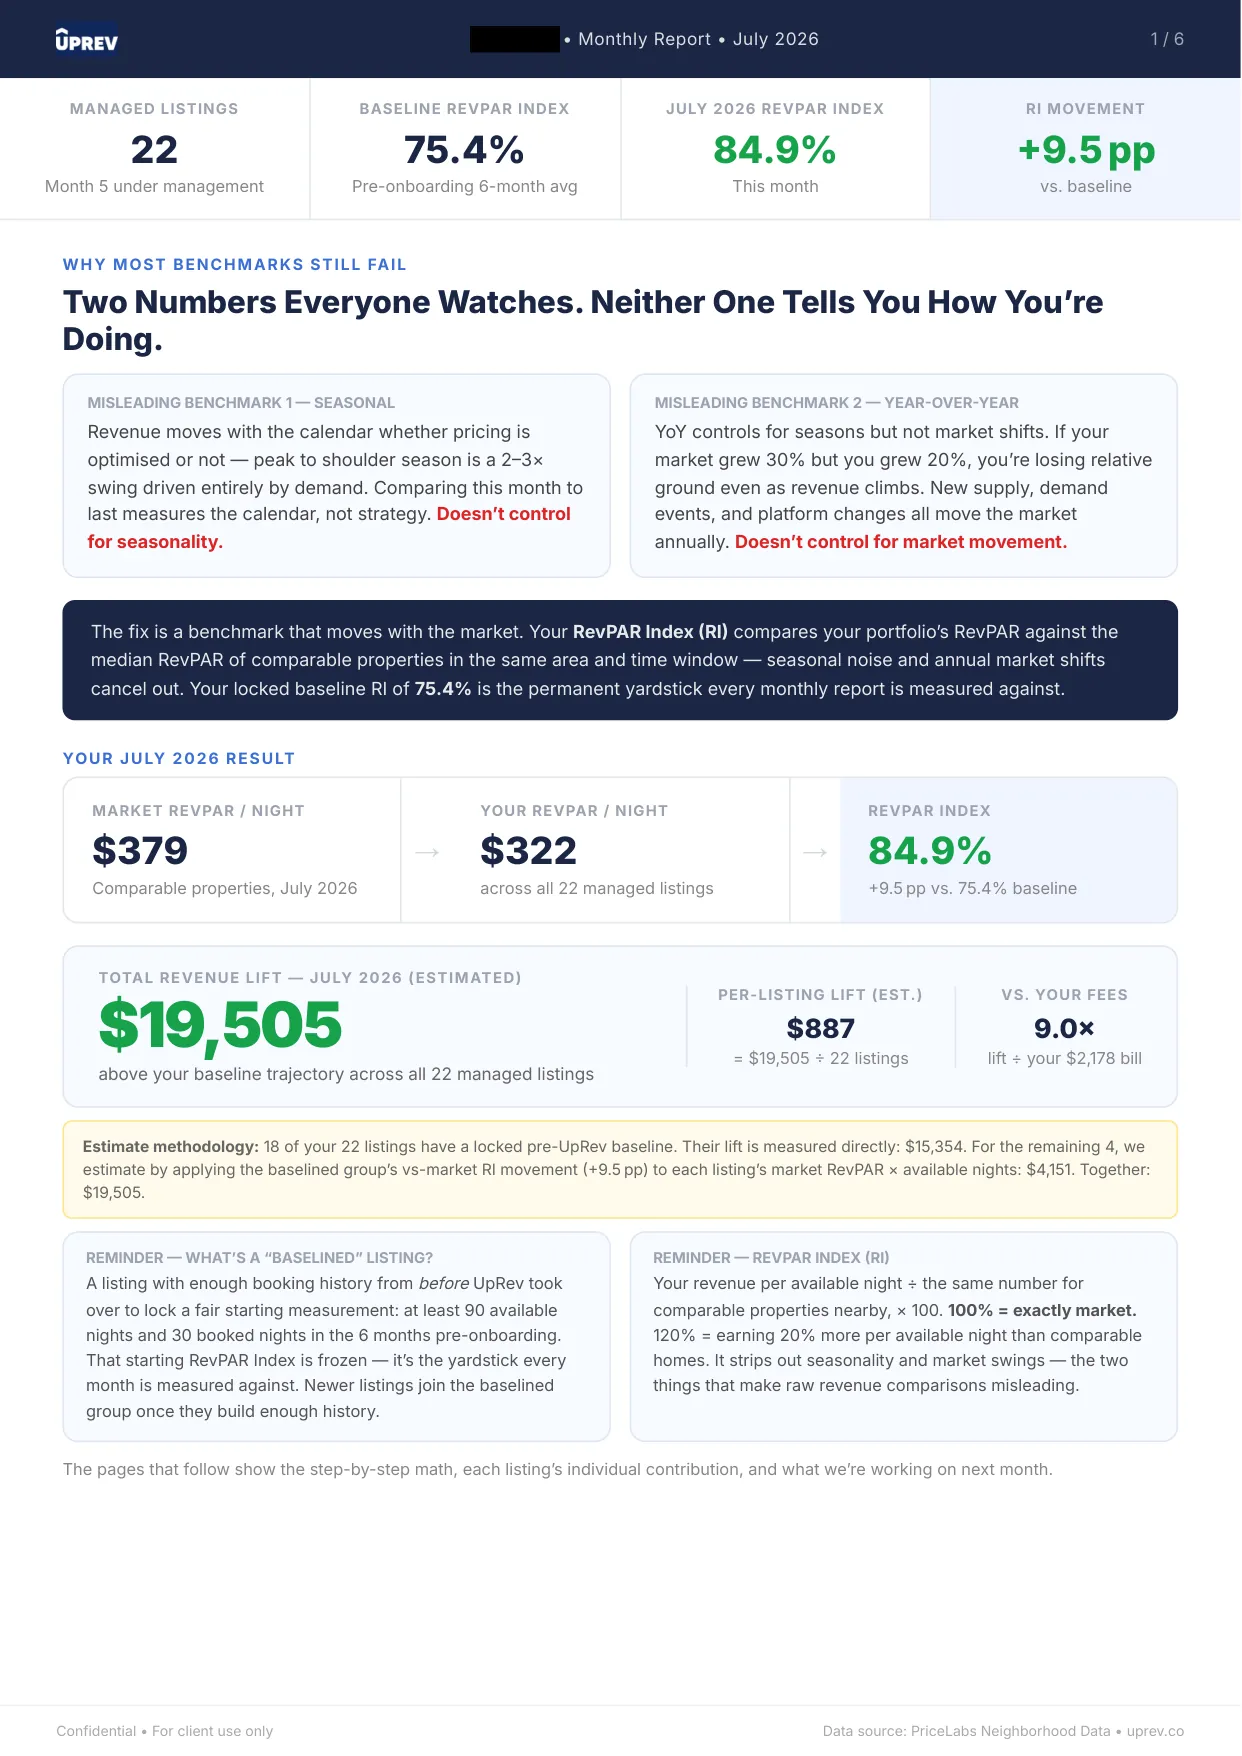
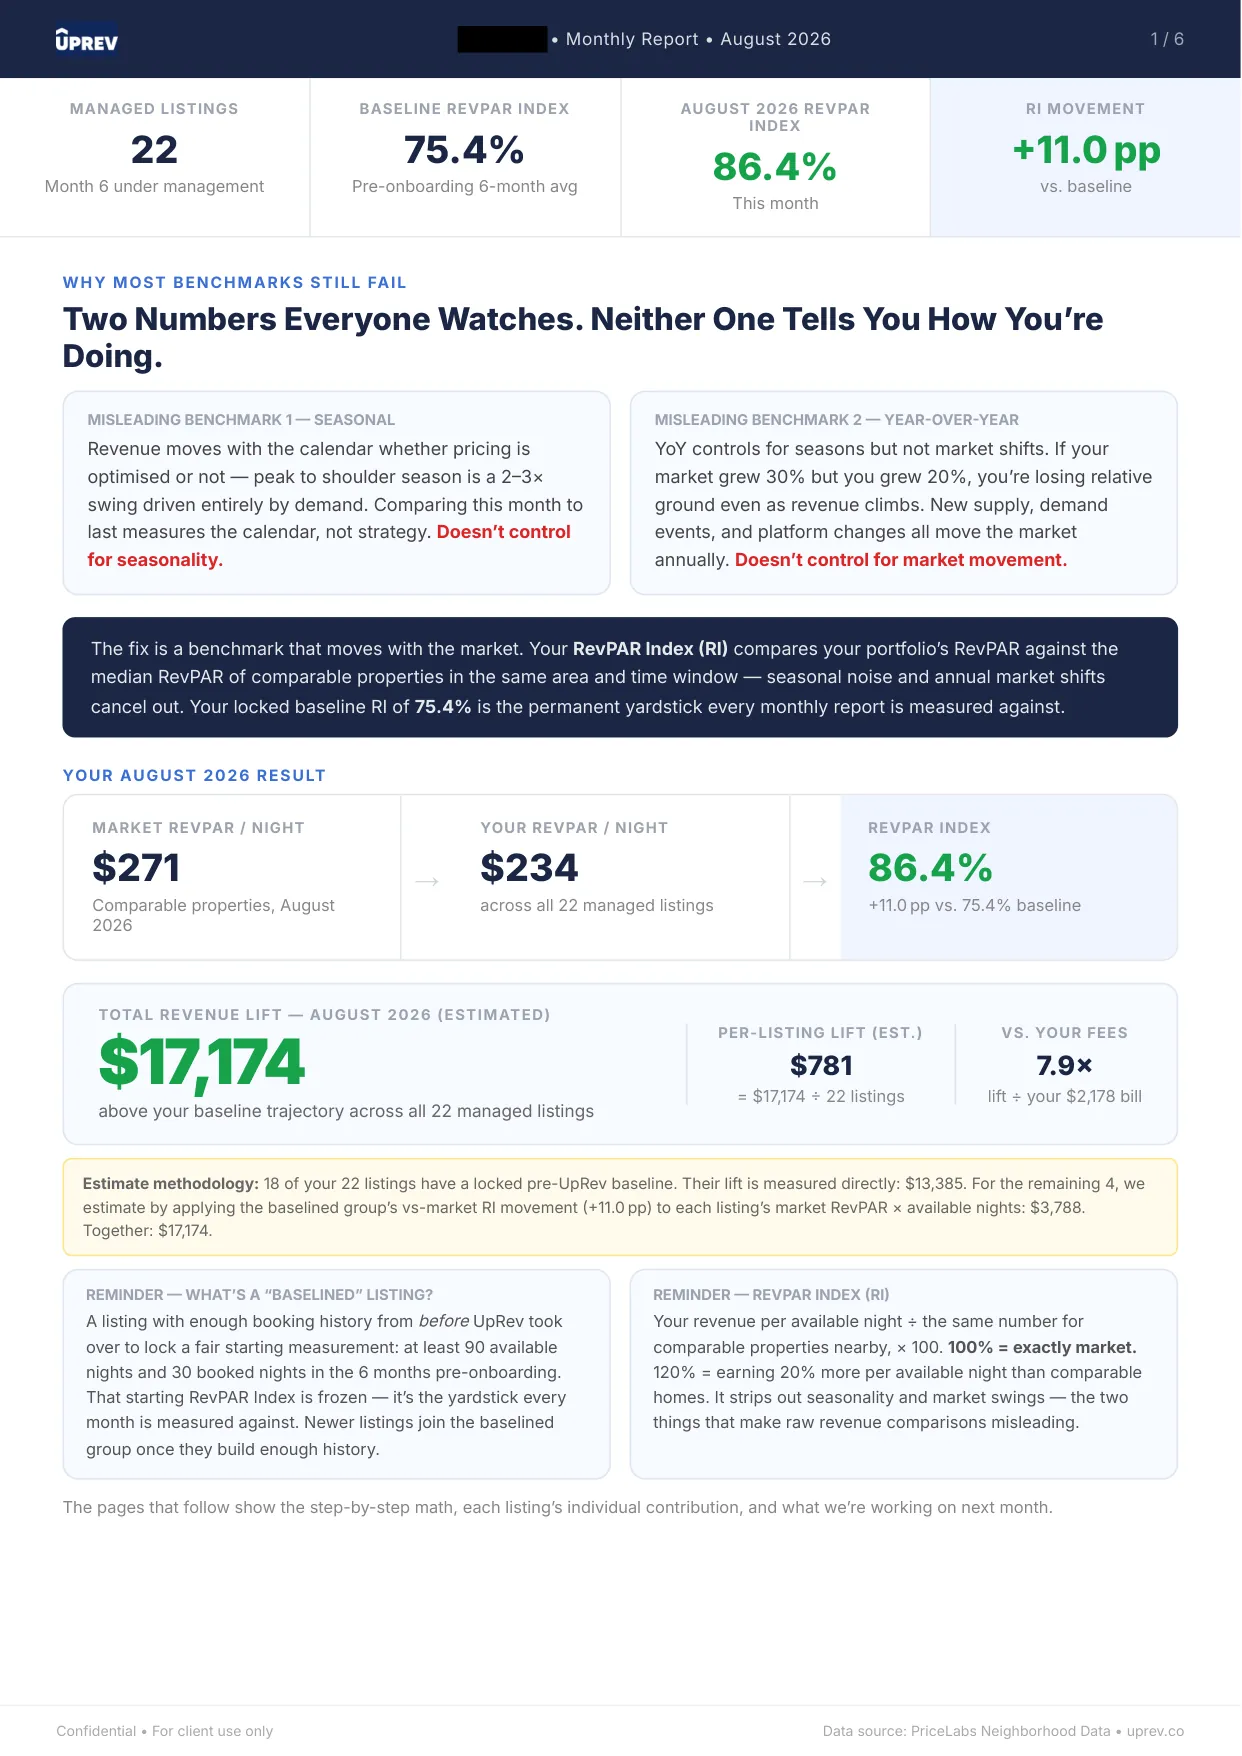
Lake Tahoe, CA
July 2026
+9.5 pts
above baseline
18
baselined listings
9.0x
our fee, covered

Tahoe is one of the rare US markets with two genuine peaks: winter around the ski lifts and summer around the lake. That double season doubles the pricing decisions that matter, and it makes the shoulder months between them the test of whether a portfolio is being managed or just left to ride.
The Tahoe reports below cover the deepest baselined listing set of any portfolio we publish. Breadth matters for reading them: a big book cannot hide behind one lucky property, so its movement above the frozen baseline reflects the pricing system, not a standout listing.
The move they show is steady rather than spectacular, and both months still clear the five-times-fee bar this page is built on. A manager weighing revenue management should see what a normal, well-run month looks like at that scale, not only the loudest result.
Company names, owner names and addresses are redacted; every figure is untouched. Full-size viewer on the proof page. How the baseline works: the frozen baseline method.
The first step is a free revenue map built from your own numbers: where each listing sits against the homes it actually competes with, and what that gap is worth. No commitment, and the map is yours to keep either way.