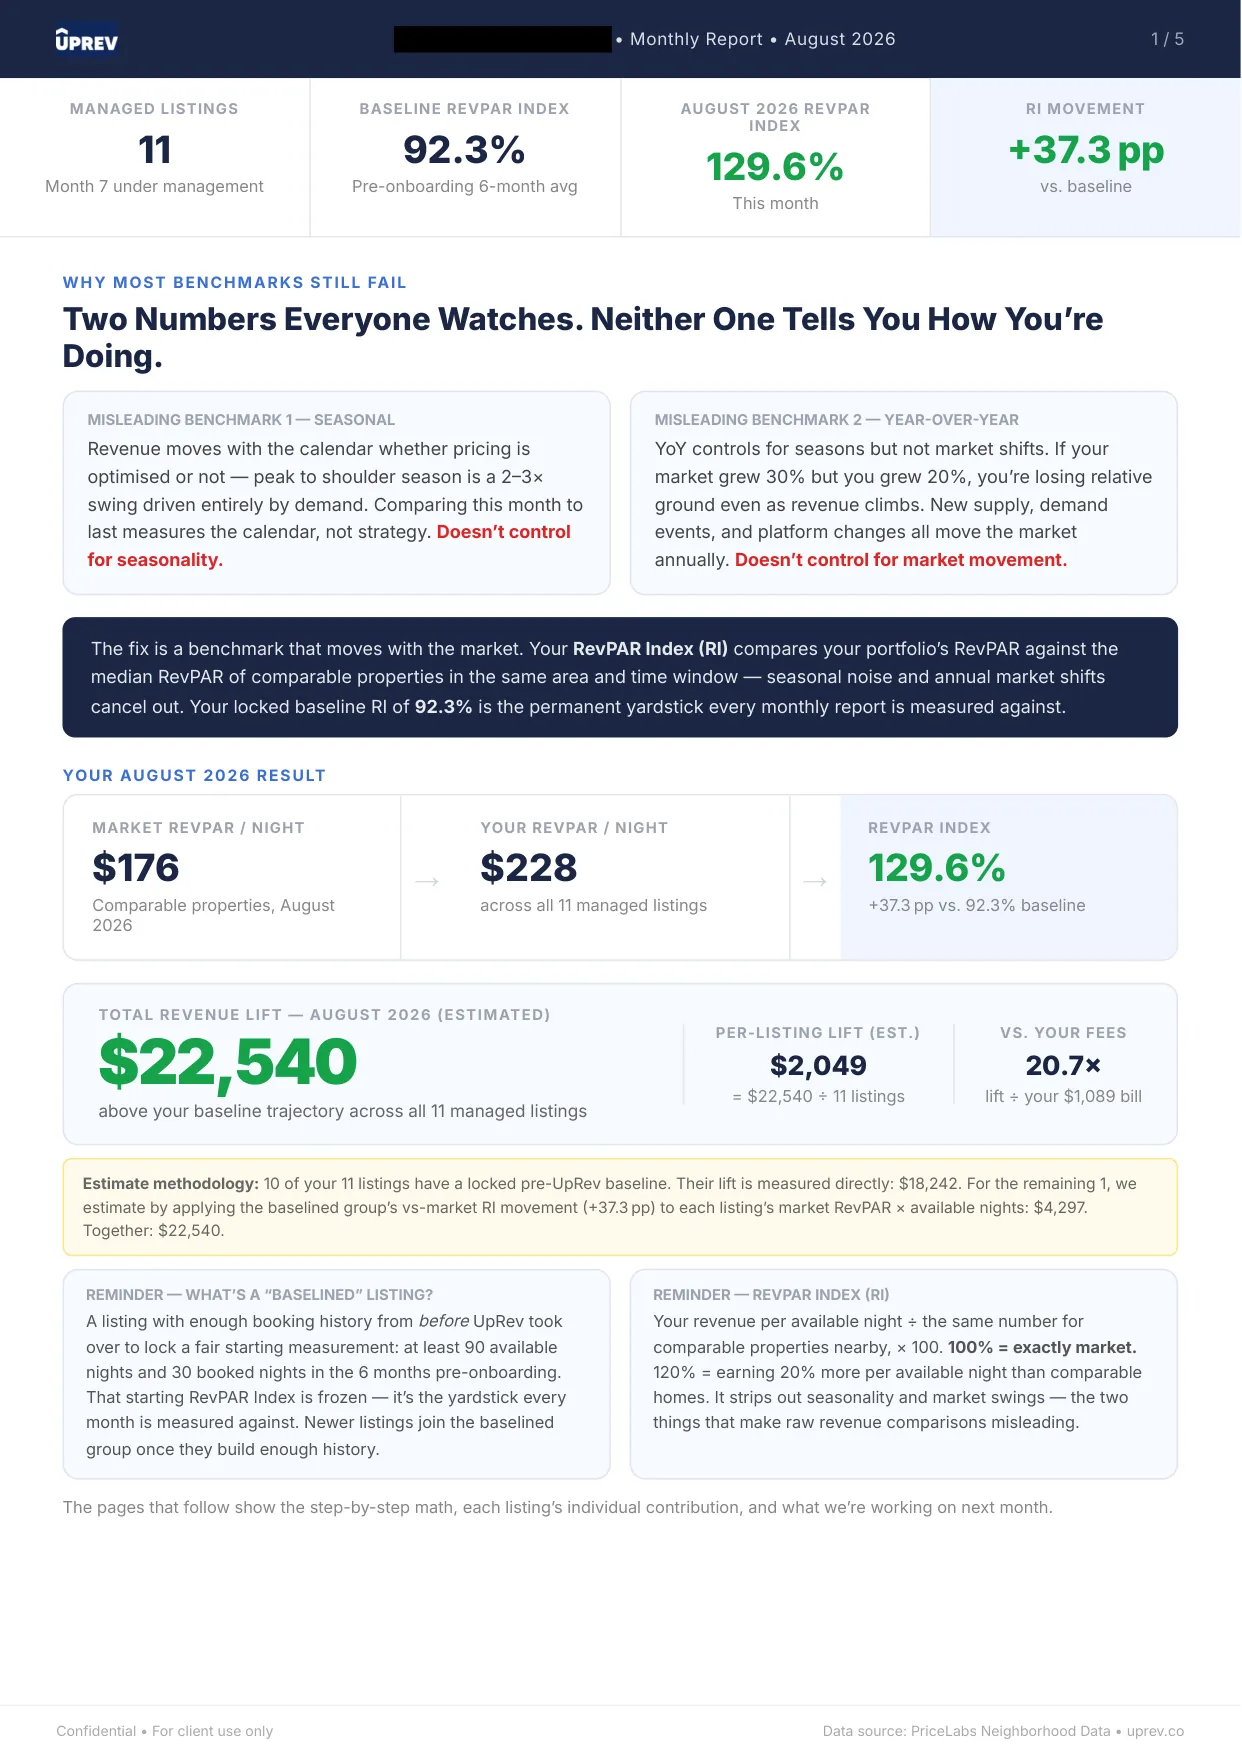
Annapolis, MD
August 2026
+37.3 pts
above baseline
10
baselined listings
20.7x
our fee, covered

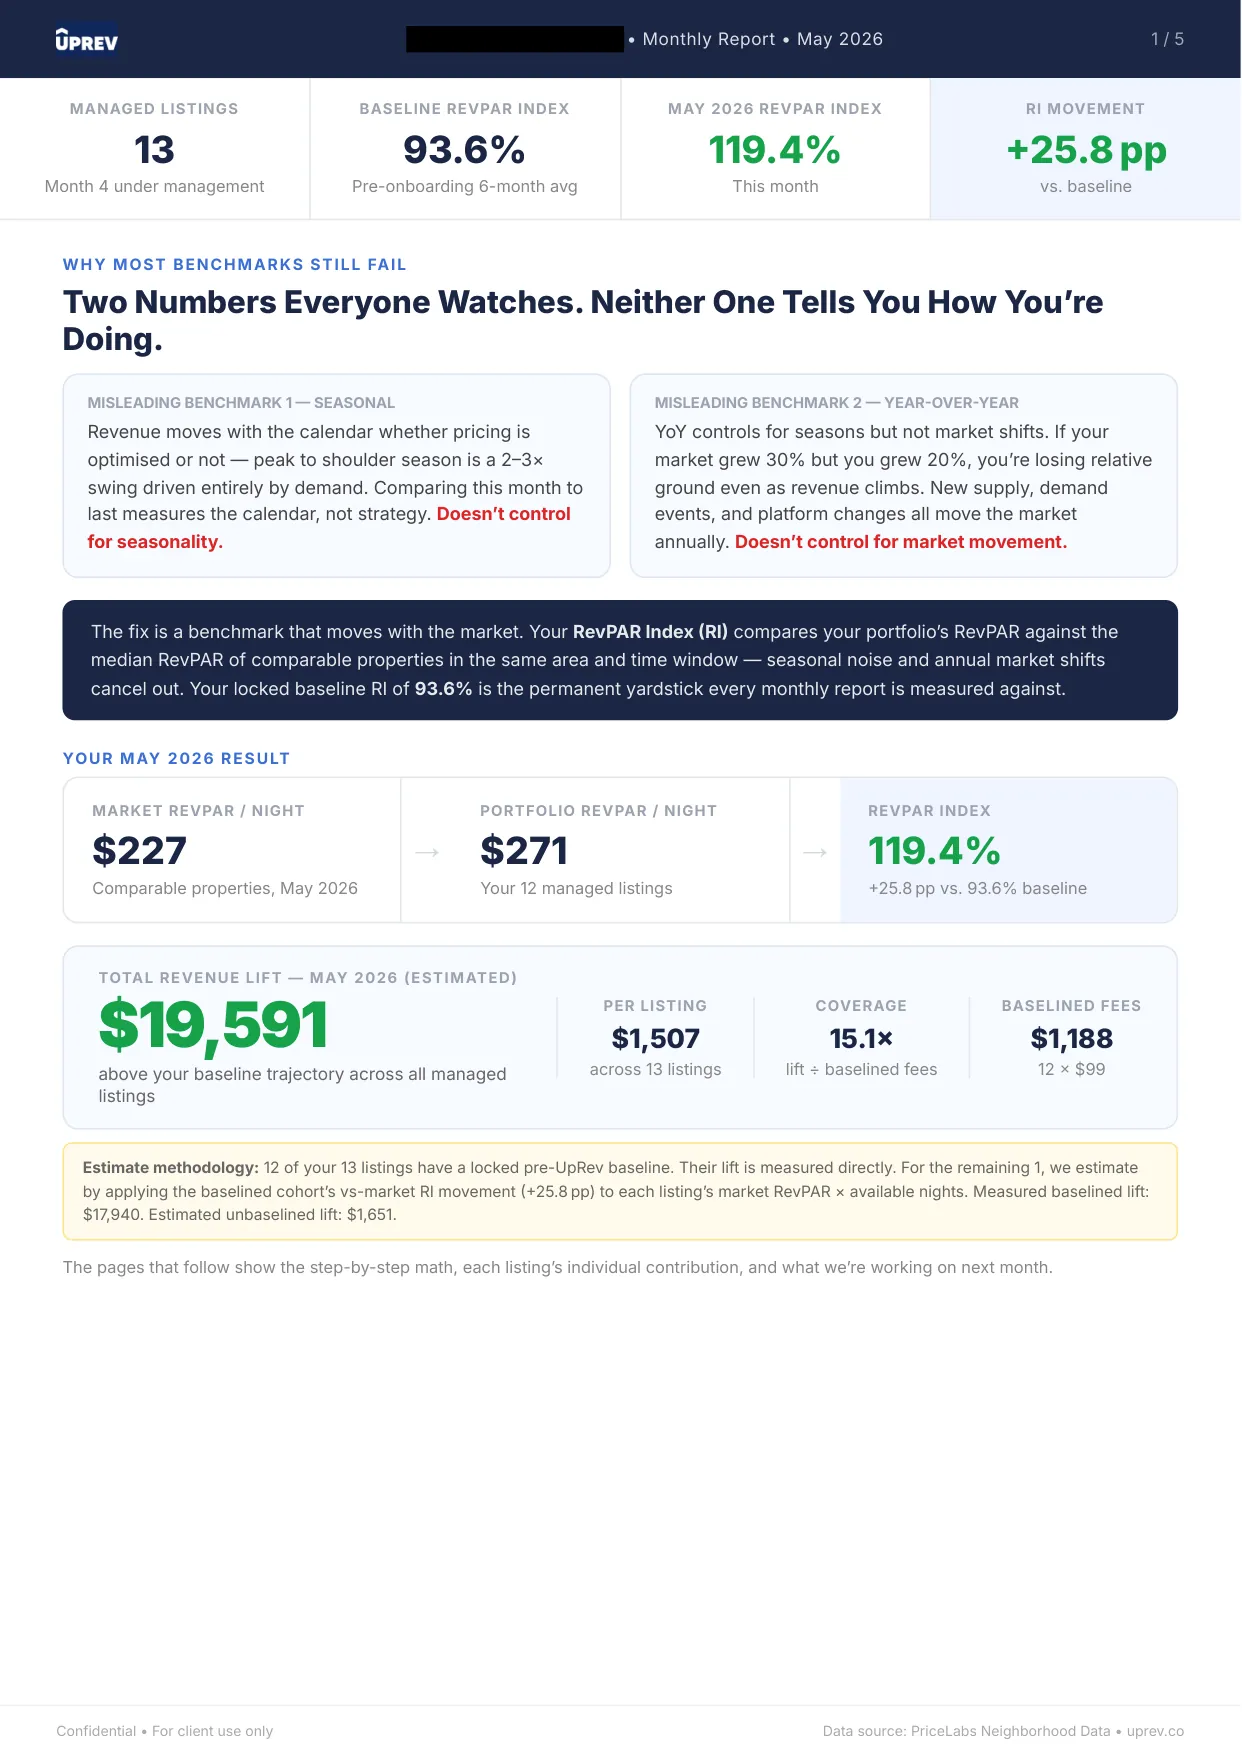
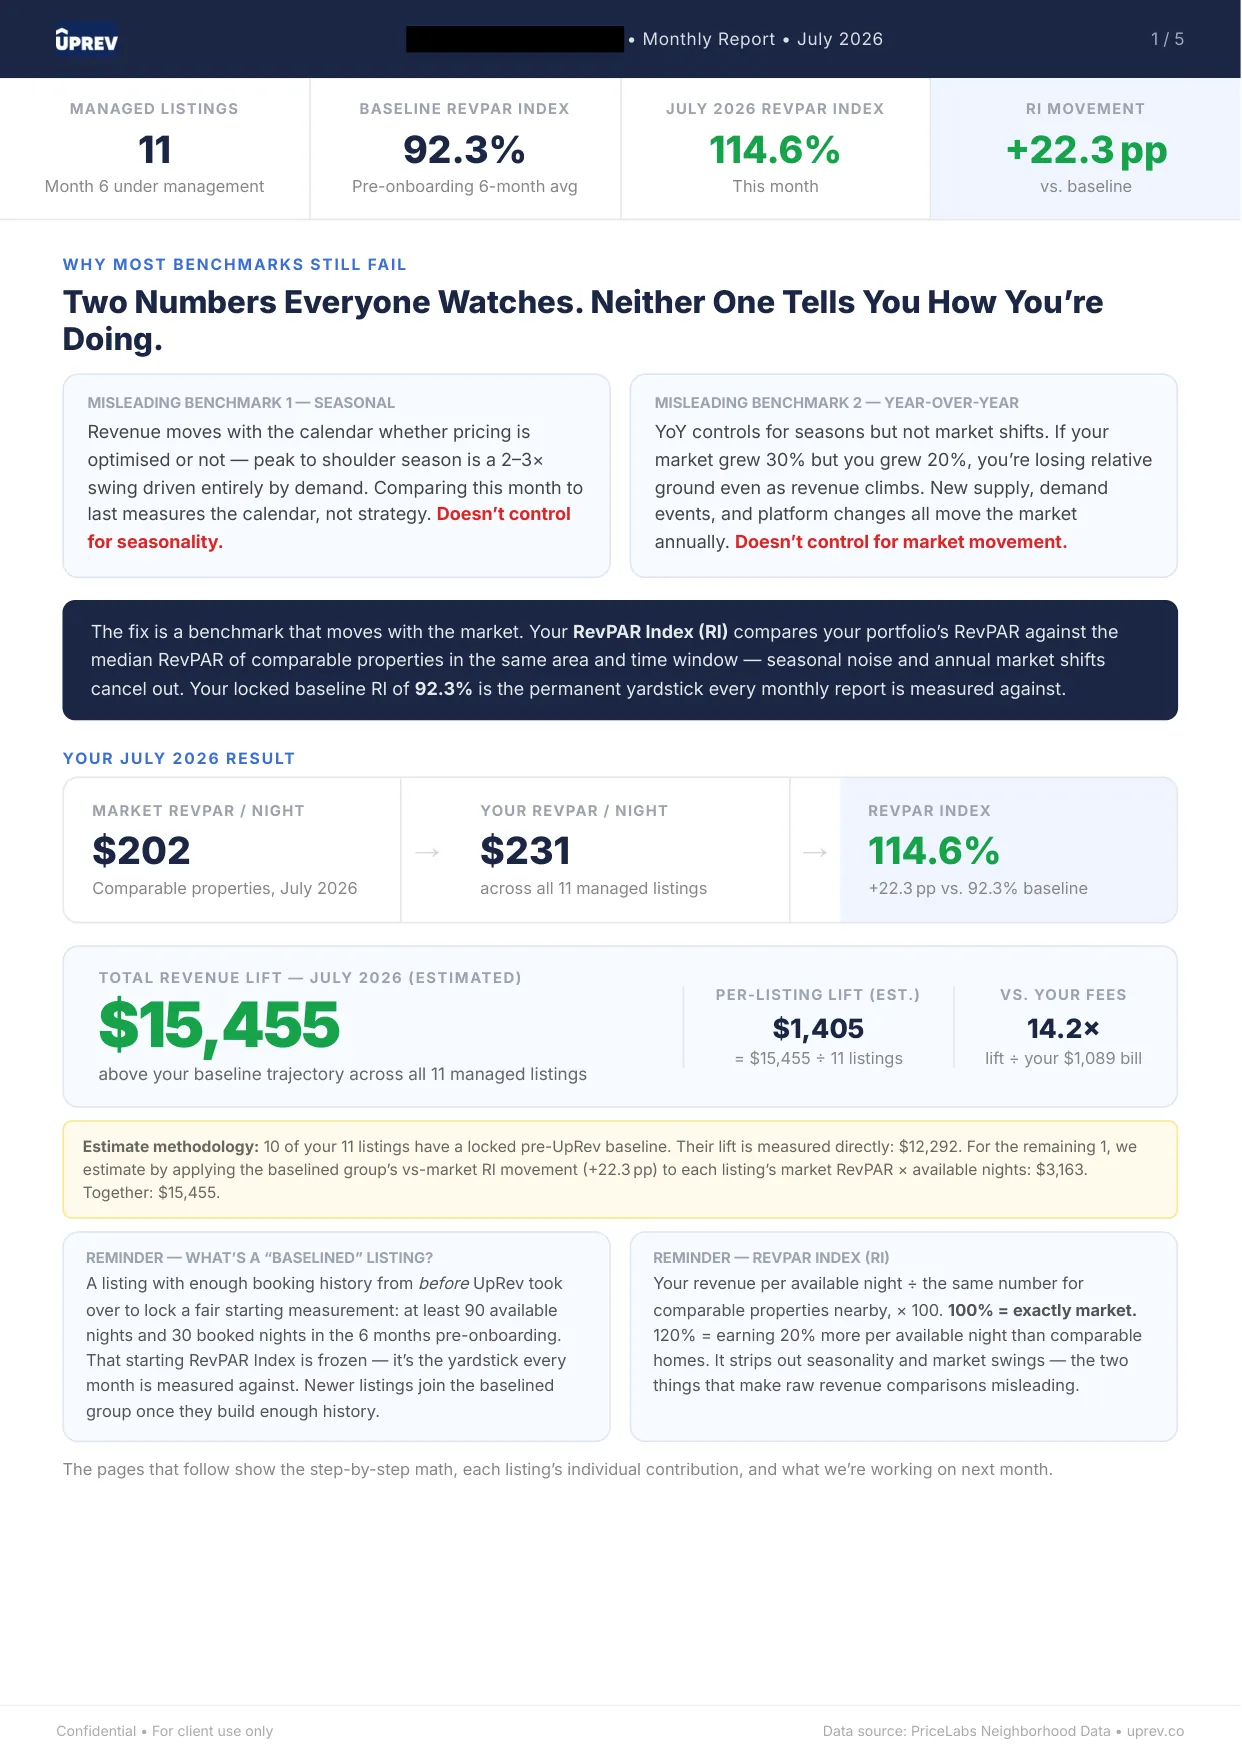
Annapolis blends leisure and obligation like few markets: Chesapeake sailing weekends, Naval Academy events, and Washington-adjacent weekenders all book the same waterfront homes for different reasons at different prices. Three report months are published below, and the point of showing all of them is repeatability.
Any portfolio can catch a good month. The Annapolis reports below span two seasons, and every one of them shows the portfolio holding a substantial margin above the score frozen at onboarding. Consistency across windows is what distinguishes a pricing system from a lucky calendar, and it is the specific thing an owner deciding whether to trust a manager should look for.
Academy weekends, sailing regattas and graduation clusters make the demand calendar here spiky and predictable at the same time. The work is in pricing the spikes fully without letting the ordinary weeks drift, and the three documents below show that balance held every time.
Company names, owner names and addresses are redacted; every figure is untouched. Full-size viewer on the proof page. How the baseline works: the frozen baseline method.
The first step is a free revenue map built from your own numbers: where each listing sits against the homes it actually competes with, and what that gap is worth. No commitment, and the map is yours to keep either way.